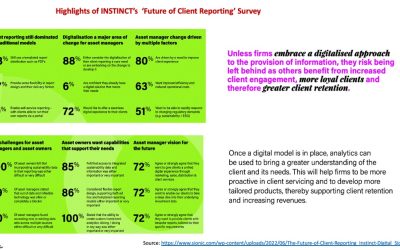
THE PROBLEM
What are some of the key analytics necessary to perform returns analysis on a multi-asset portfolio?
THE APPROACH
1. Returns Details – This is holding period returns data slides/diced by country, currency and any other related security attributes. As returns data is additive, we can group the same by any/all the portfolio’s security level attributes. In addition, other returns type such as IRR, Annualized and time-series of the returns would be helpful.
2. Core Performance Measures – Treynor Ratio, Sharpe ratio, Jensen’s Alpha, Kurtosis, Skewness, etc.
3. Benchmarks Returns Details – Information ratio, Tracking Error, etc.
4. Return Attribution Data – This can be both Bottom up and Top-down approach to understand the investment decision or effects of allocation, selection and interaction of securities within the portfolio.
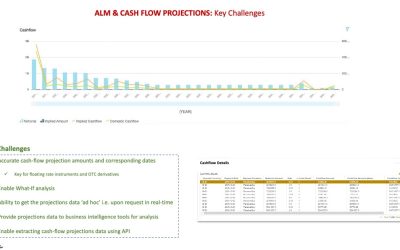
Bringing all this data into a BI data store (such as snowflake/Redshift) will be necessary for real-time view to make the analysis easier and more effective (See below image for a sample data set).
HOW TO?
As has been the key theme through the posts related to real-time BI Analysis – use of modern ‘cloud’ technology using a microservices architecture that can scale dynamically depending on data volume.
This will enable firms to operate using the ‘Pay Per Use’ business model – a key competitive differentiator in the long-term for deeper actionable insights.