

RISK ANALYTICS
VaR Analysis
Portfolio and Security VaR details including Historical, Parametric, Diversified/Undiversified, Incremental, Marginal, Component VaR and Expected Shortfall.
Backtesting VaR enables validation and periodic re-calibration of VaR models as necessary

Overview
Value At Risk (VaR) is a risk measure widely used by Institutional managers and managers holding multi-asset portfolios. It is also one of the primary risk metrics required for reporting to many global regulators.
VaR is the maximum loss a portfolio experiences for a confidence level and time horizon. For example, we can say that a portfolio cannot lose more than USD 1 Million at 99% confidence level for a 10 day time horizon.
While VaR just tells how bad it can get, Expected Shortfall complements VaR because it tells us the expected loss if things get bad and therefore to get an better picture of portfolio risk a combination of VaR, Expected Shortfall and scenario analysis/stress testing results is necessary.
Key Features
Historical Simulation, Parametric and Monte Carlo VaR
Historical Simulation VaR
Popular and uses historical data
Parametric VaR
Simple to implement, Returns based and use Variance-CoVariance approach.
Monte-Carlo VaR
Uses simulation techniques and the most complex of the three methods
Expected Shortfall (CVaR)
Expected shortfall is a popular measure that tells us the average losses beyond VaR. It si also called Conditional VaR or CVaR.
Marginal, Incremental, Component and Diversified/Undiversified VaR
Marginal VaR
It is the change in VaR resulting from taking an additional dollar exposure to a given position.
Incremental VaR
Increase in VaR from taking on an extra position or removing a position from a portfolio
Diversified VaR
Portfolio VaR derived taking into account the diversification benefits between the assets.
Undiversified VaR
Portfolio VaR derived by summing up VaR of positions within the portfolio i.e. without consideration of diversification benefits between the assets.
Component VaR
It is the break down of portfolio’s Diversified VaR into VAR at each position. Therefore sum of the component VaR of the portfolio will be equal to Diversified VaR. This decomposition is useful with large portfolios where size of each position will be small.
Backtesting VaR
Backtesting VaR is an approach to validate risk models used to calculate VaR. The process compares forward looking P&L (i.e. VaR) to actual performance results.
When the prediction is out of tolerance, the risk analyst can input comments providing a reason for the model’s results (unusual market condition or event maybe one reason). Based on the results of backtesting the model may need tuning to ensure it continues to be a good predictor of portfolio risks.
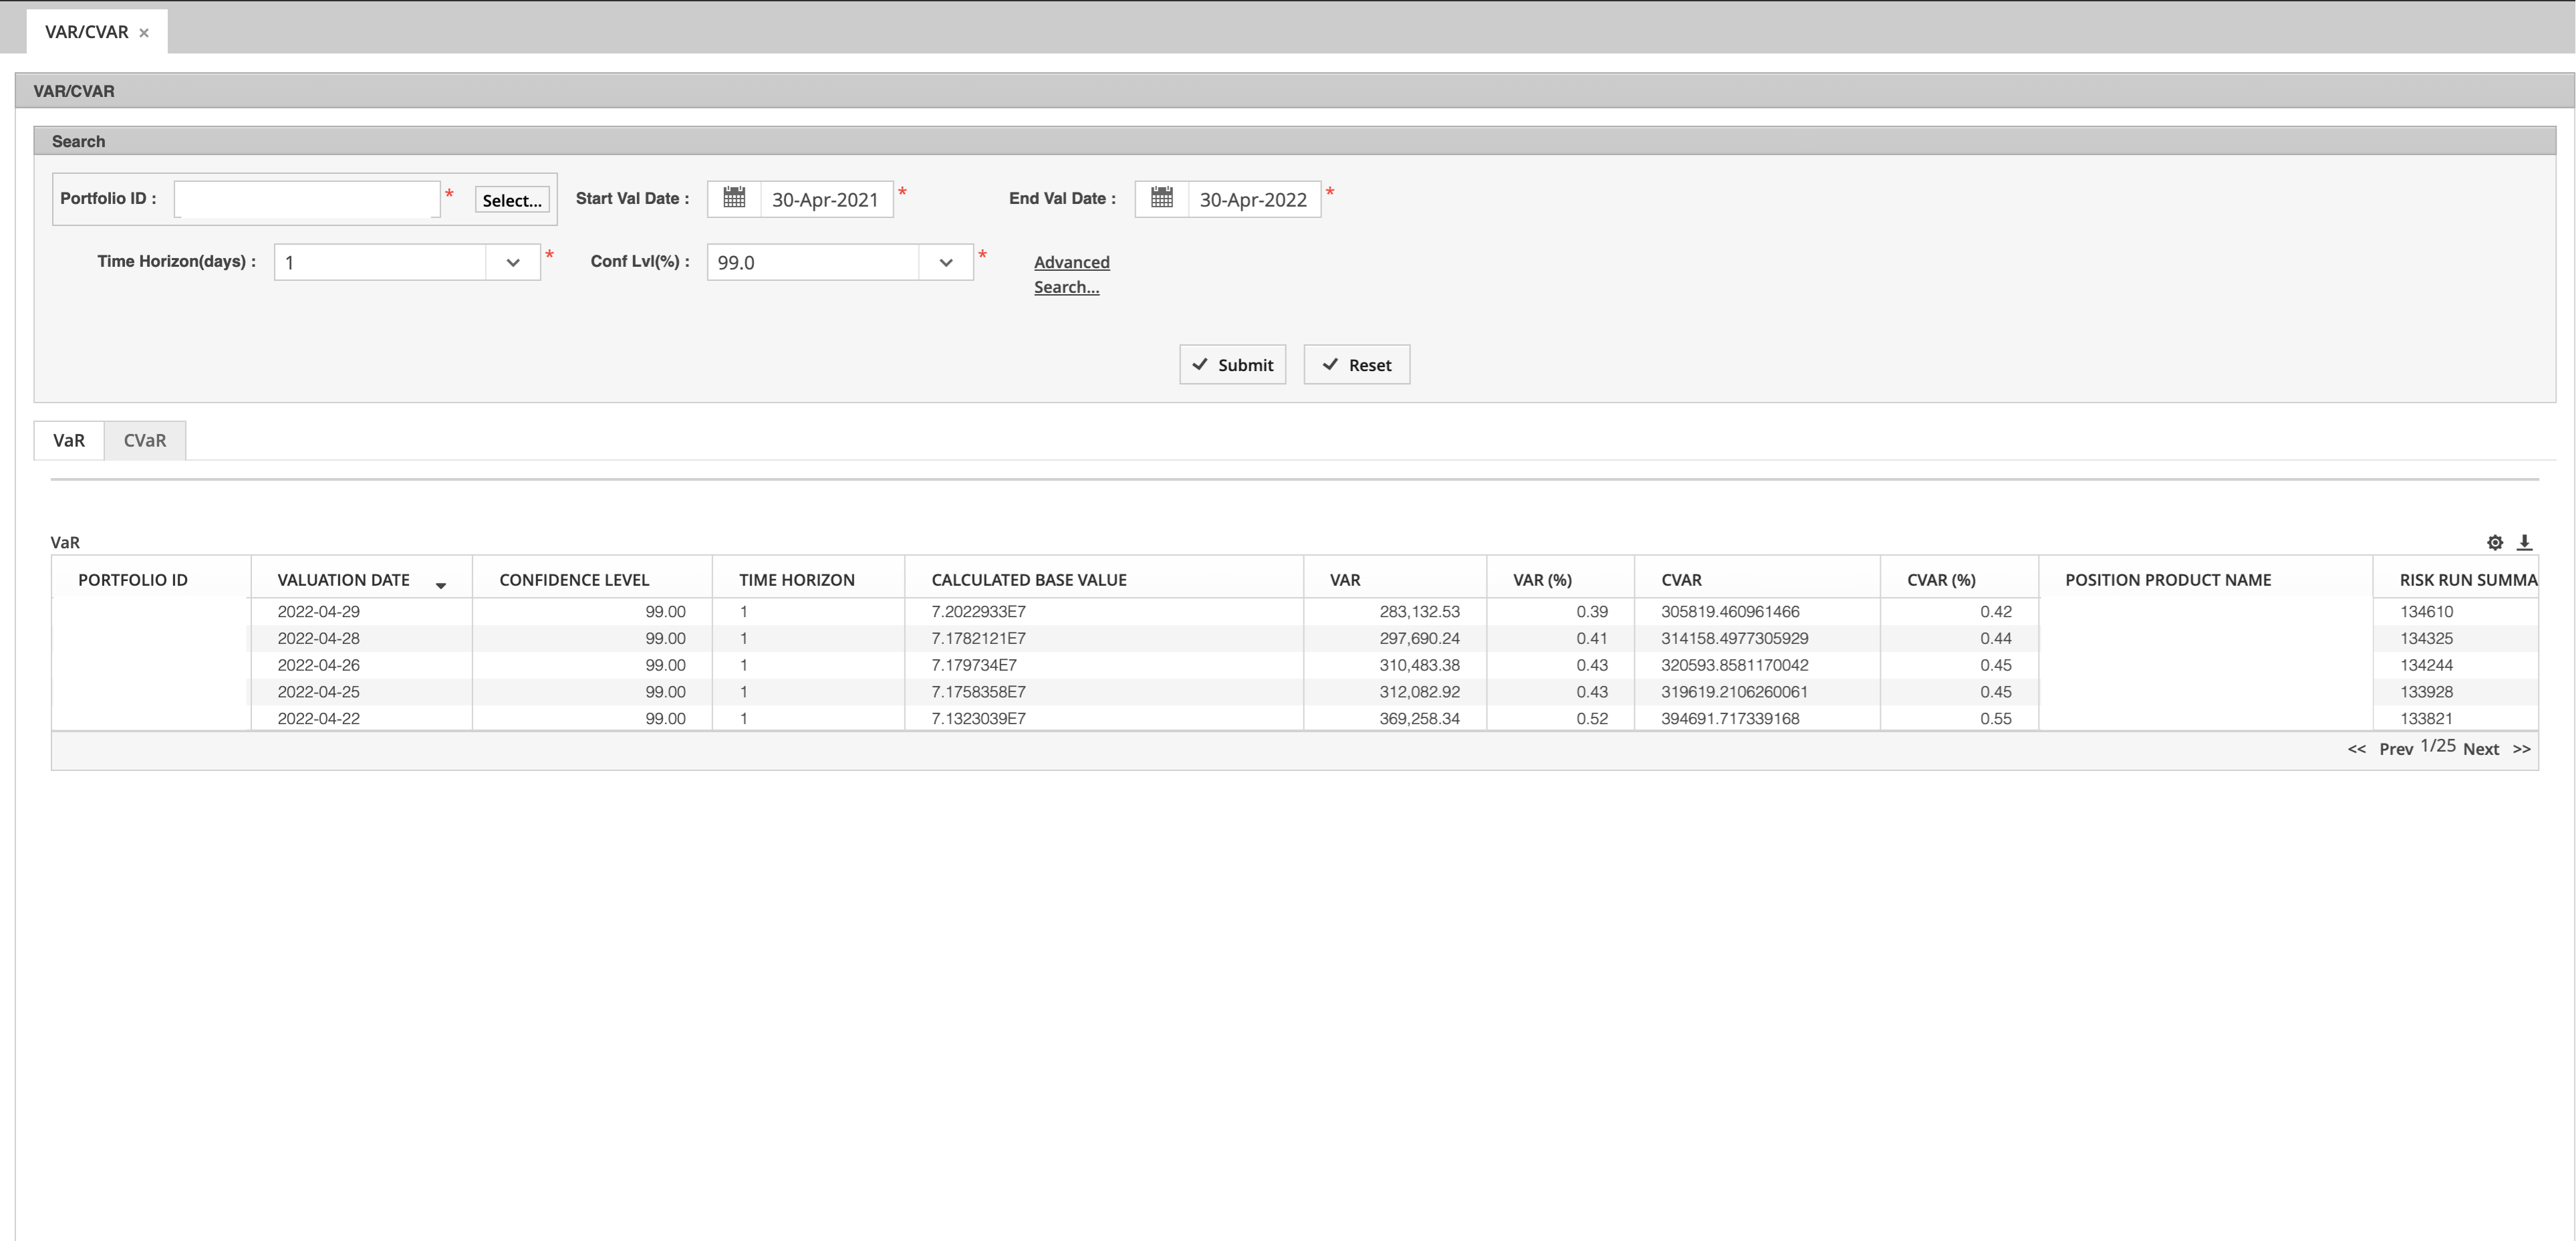
VaR Screenshots
Configuration and results for key VaR Analytics


VaR Demo
Configuration and results for key VaR Analytics
FAQ
Here are some answers to Frequently Asked Questions.

Are VaR Parameters Configurable?
Confidence level, sample size, Time Hosrizon is configurable dynamically.
Can we run VaR calculations ad-hoc?
All risk calculations can be run by users using user interface and calculation results can be viewed using web user interface.
Calculations are not batched and are run as and when requests are made.
System scales the number of engines required dynamically as volume of requests increase and the number of engines are brought down if no requests are pending thus enabling pay-per-use business model.