Total Portfolio View
Unified visibility across holdings, risk, performance, and accounting—in a single BI-enabled platform. No more pulling data from five systems to answer one question.
Unified visibility across holdings, risk, performance, and accounting—in a single BI-enabled platform. No more pulling data from five systems to answer one question.
Today's buy-side firms operate with portfolio data scattered across multiple systems—leading to reconciliation overhead, slow response times, and incomplete insights.
Total Portfolio View brings together four essential dimensions of portfolio management into a single, unified platform.
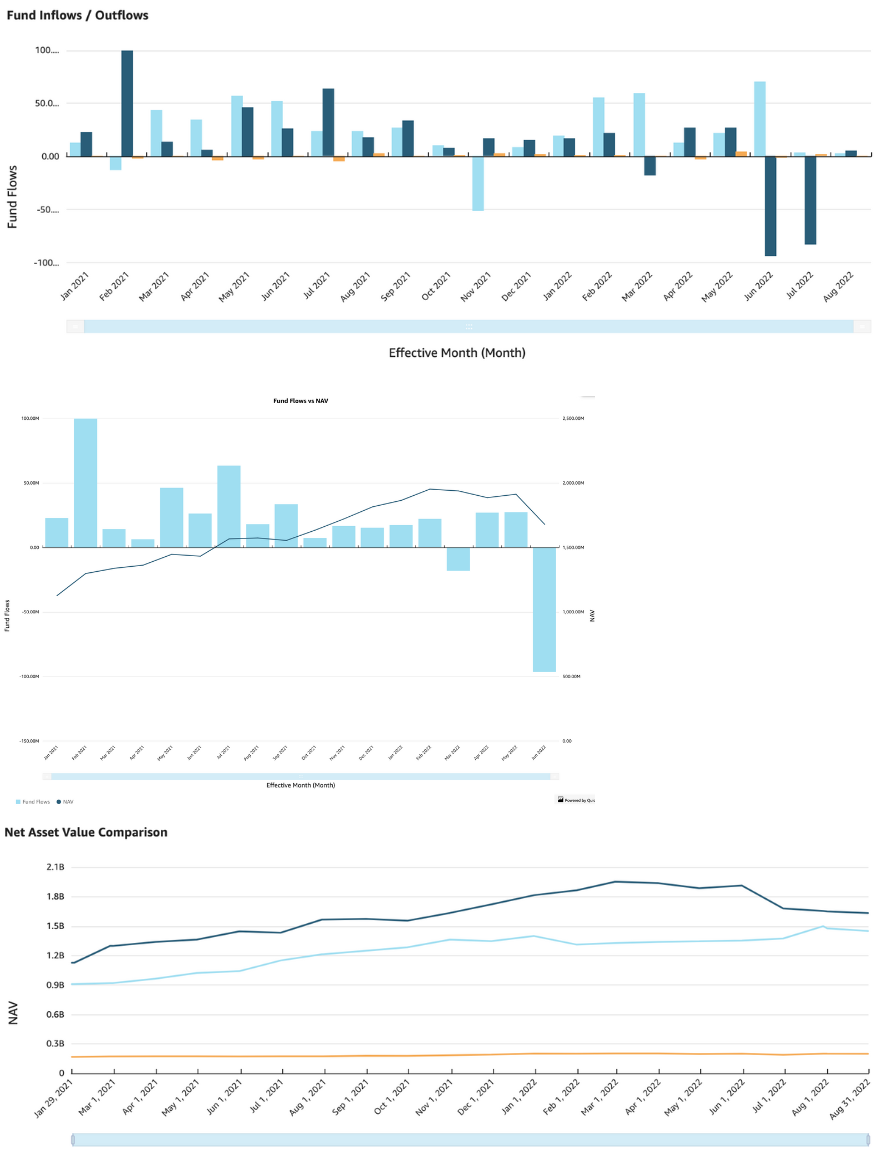
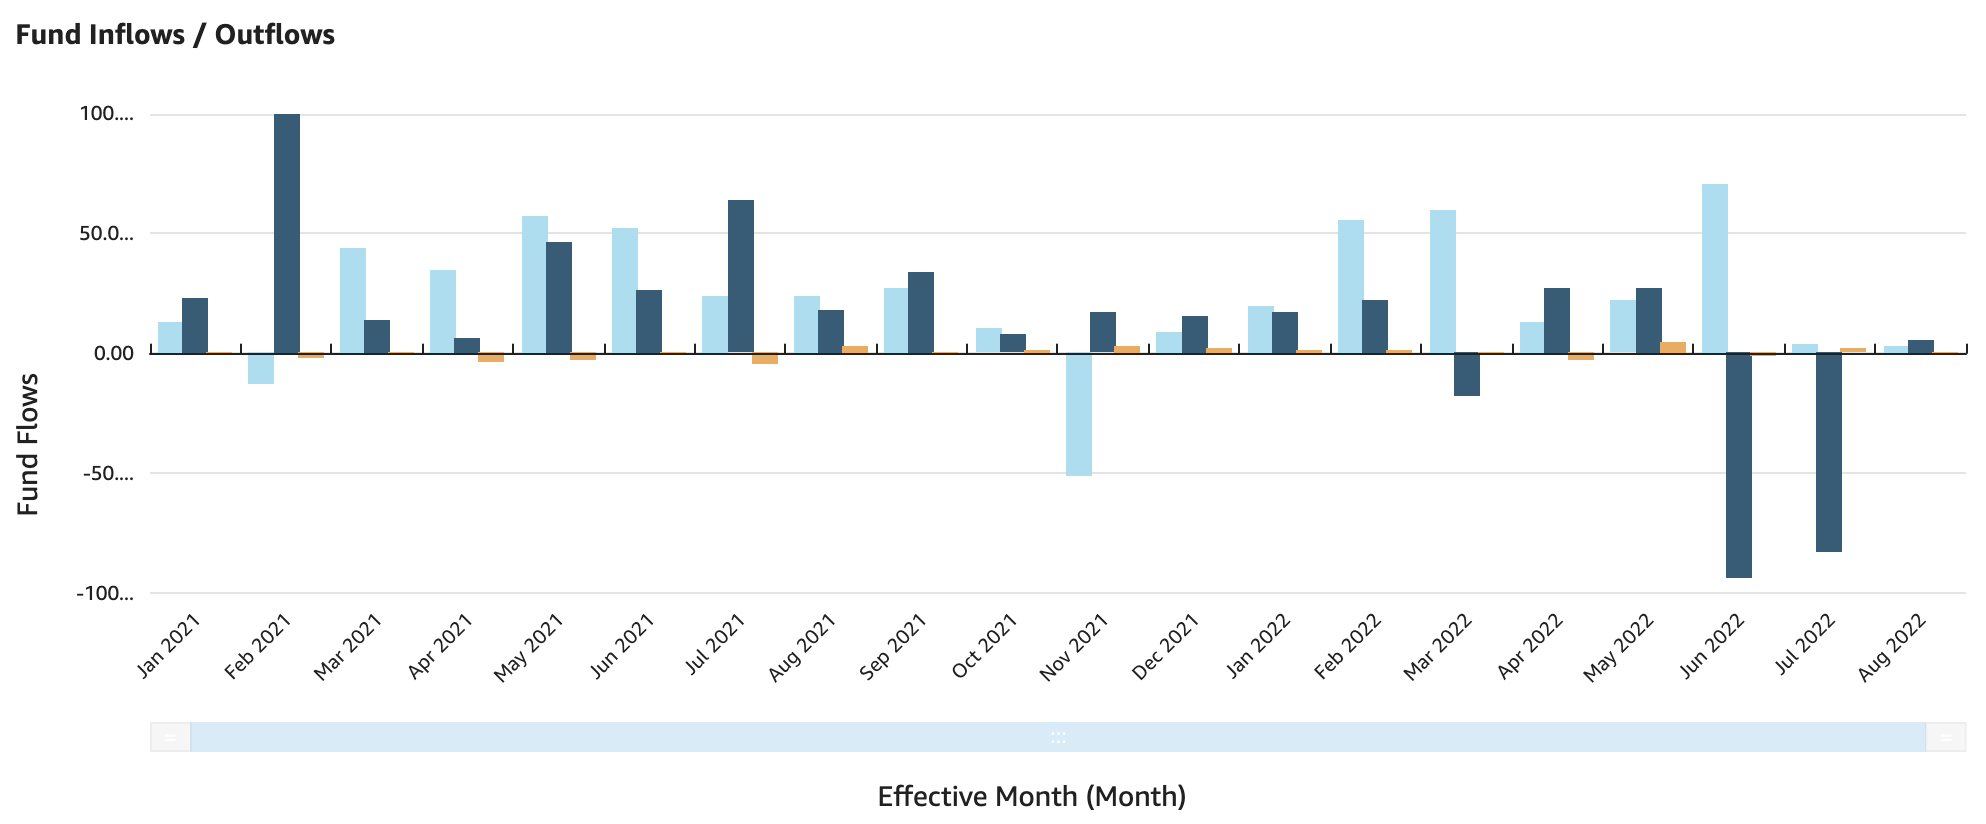
Real-time positions, exposures, and allocations across all asset classes with look-through for complex structures.
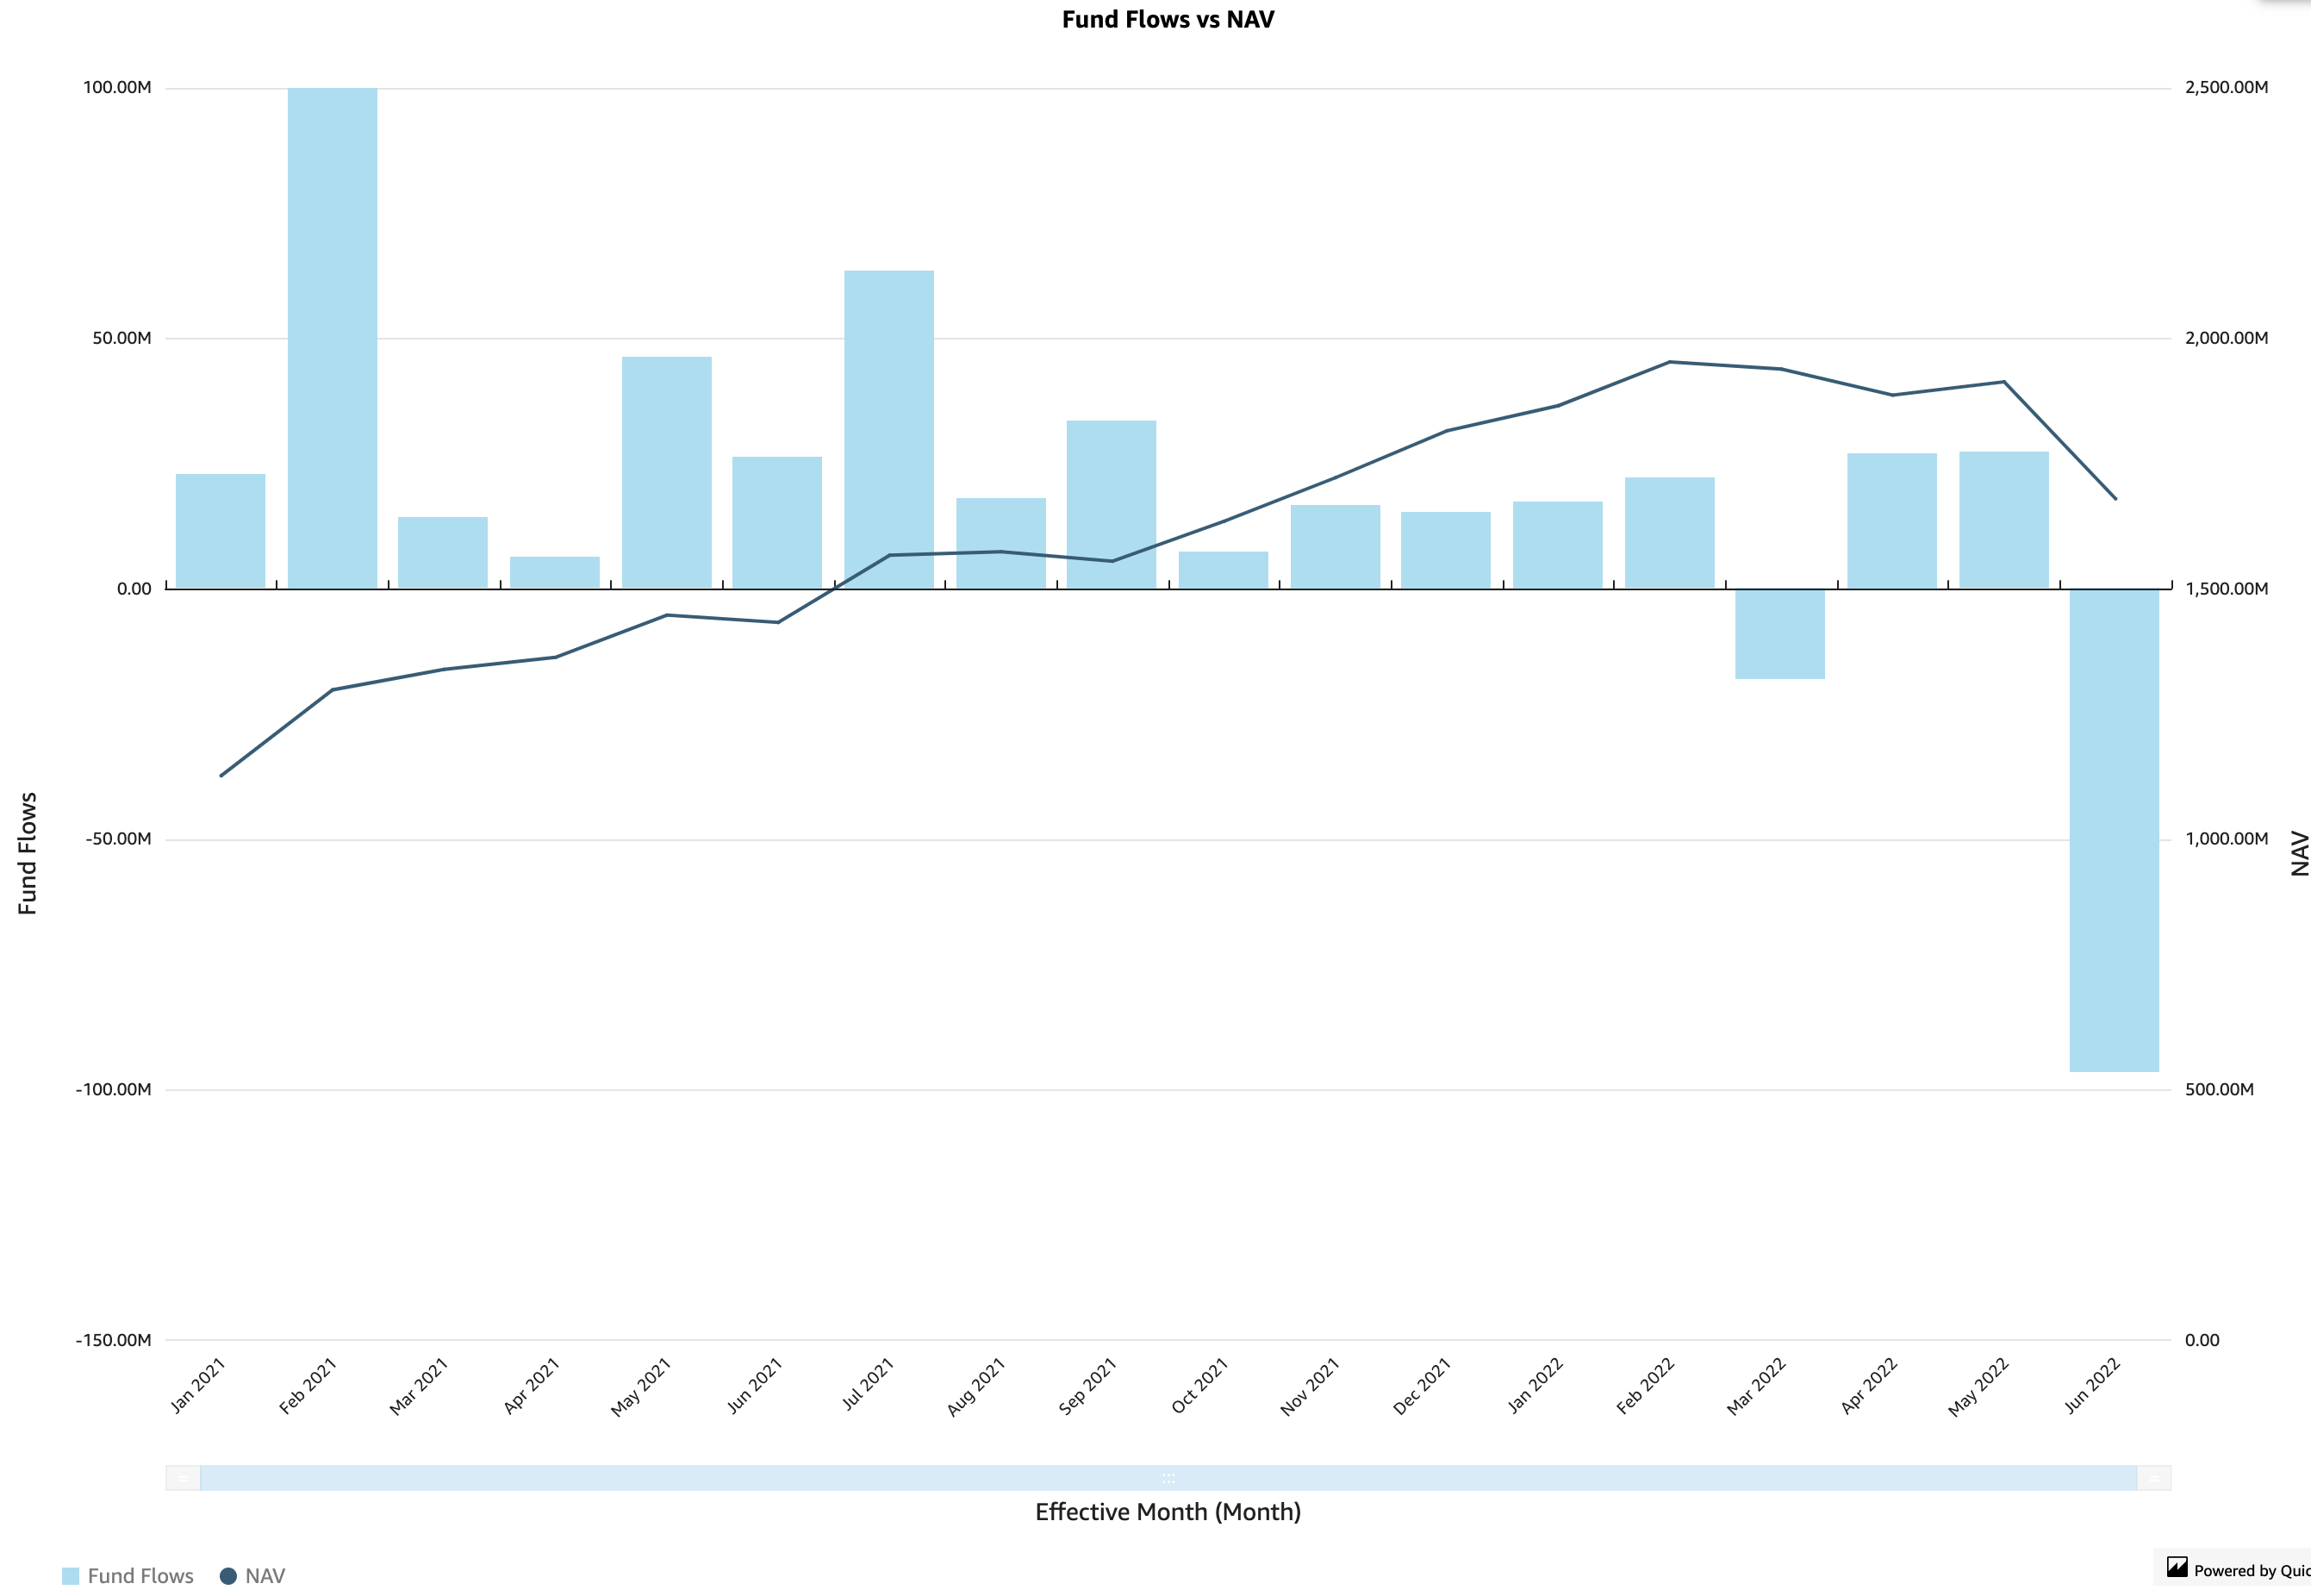
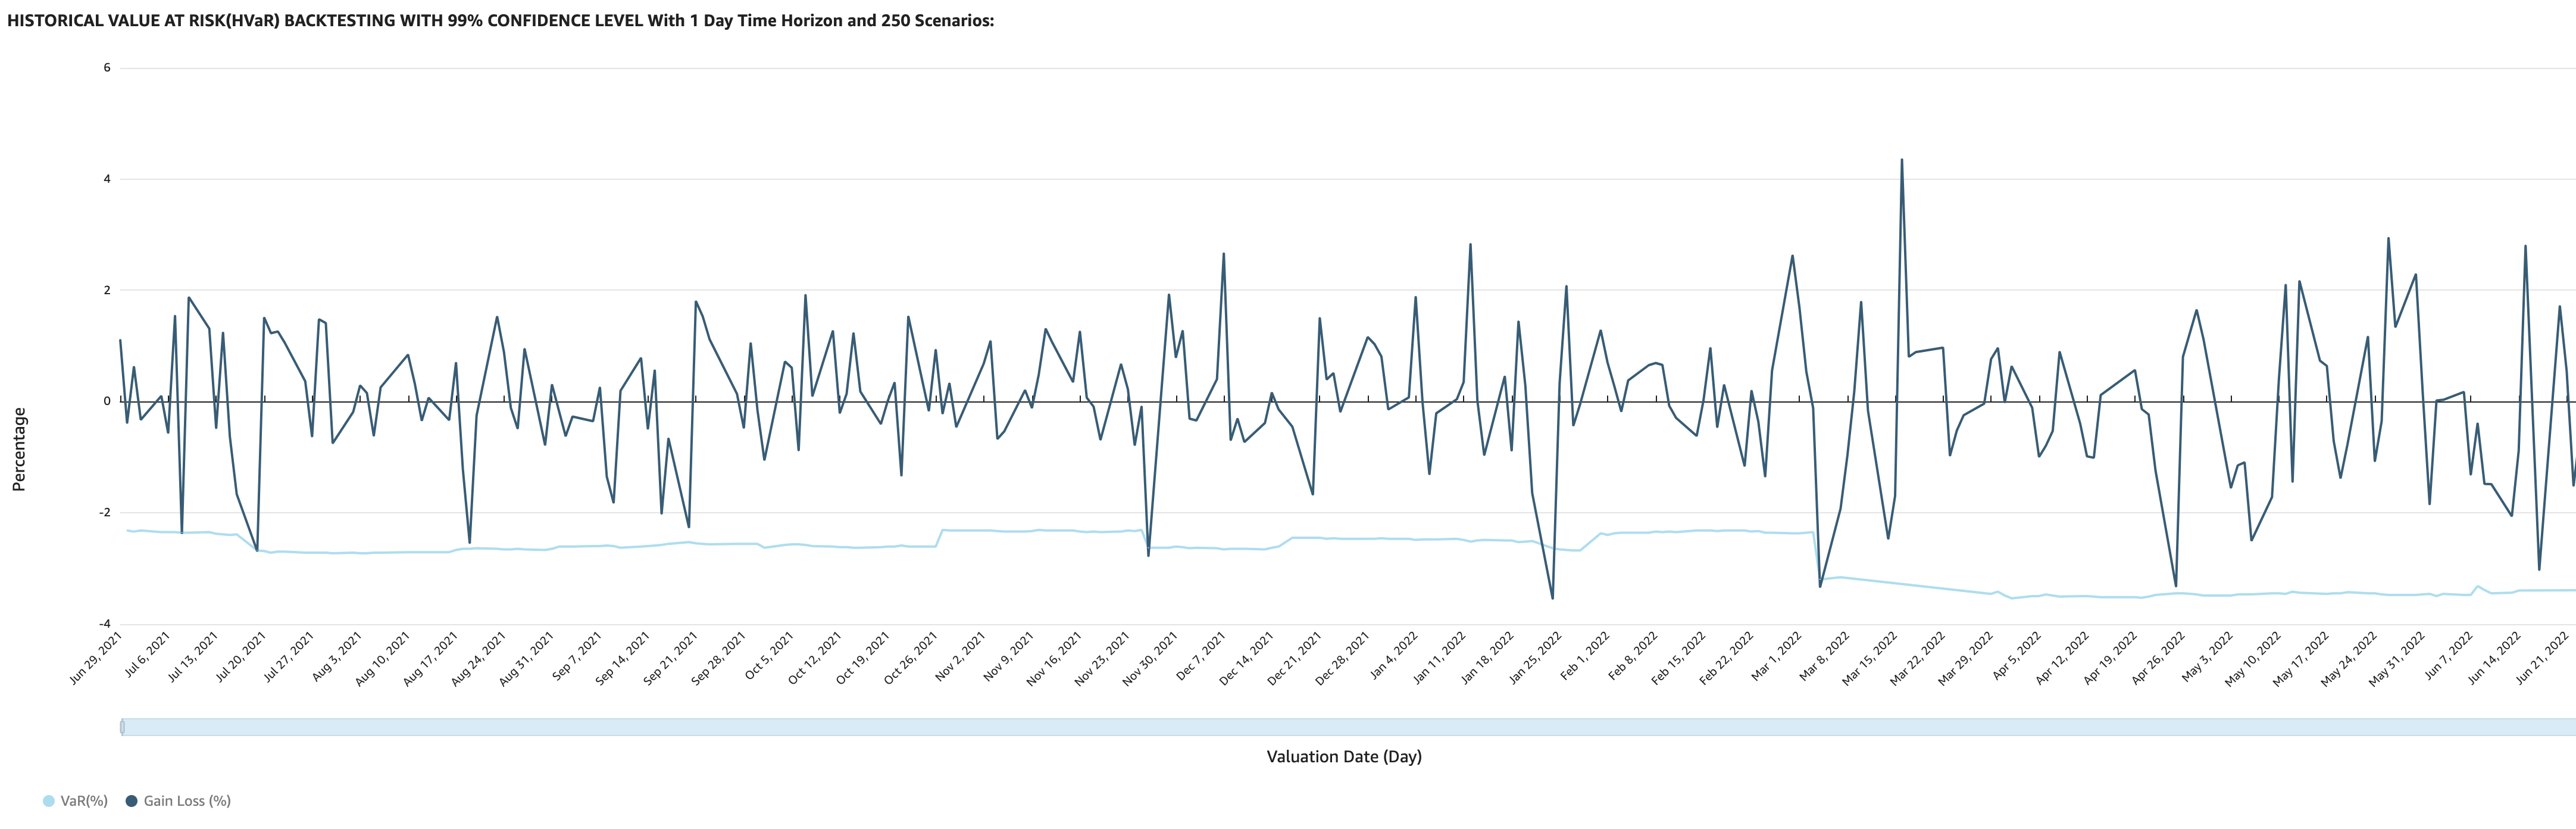
Ex-ante and ex-post risk analytics integrated directly—VaR, stress tests, sensitivities, and more.
Returns and attribution analysis using the same data, so you understand not just what happened but why.
NAV, P&L, and cash flows from the same source—the financial reality underlying your investment decisions.
When holdings, risk, performance, and accounting all come from the same data source, the numbers match—guaranteed.
Data should serve users, not trap them. Total Portfolio View makes portfolio data accessible through the BI tools you already use.
When investors call asking about risk during market volatility, you can answer immediately—not tomorrow.
See performance and risk metrics side-by-side. Understand not just how you performed, but why—and what risks contributed to or detracted from returns.
Drill down into positions across all portfolios. Slice and dice by asset class, sector, currency, or any custom dimension your firm needs.
Total Portfolio View exposes portfolio data through standard interfaces that connect to the BI tools your team already knows.
Total Portfolio View collects data from your existing systems and presents it through a unified data model for analytics and reporting.
Instant calculation using current positions and prices—not yesterday's batch run.
Attribution available in the same interface as holdings and risk—no manual data gathering.
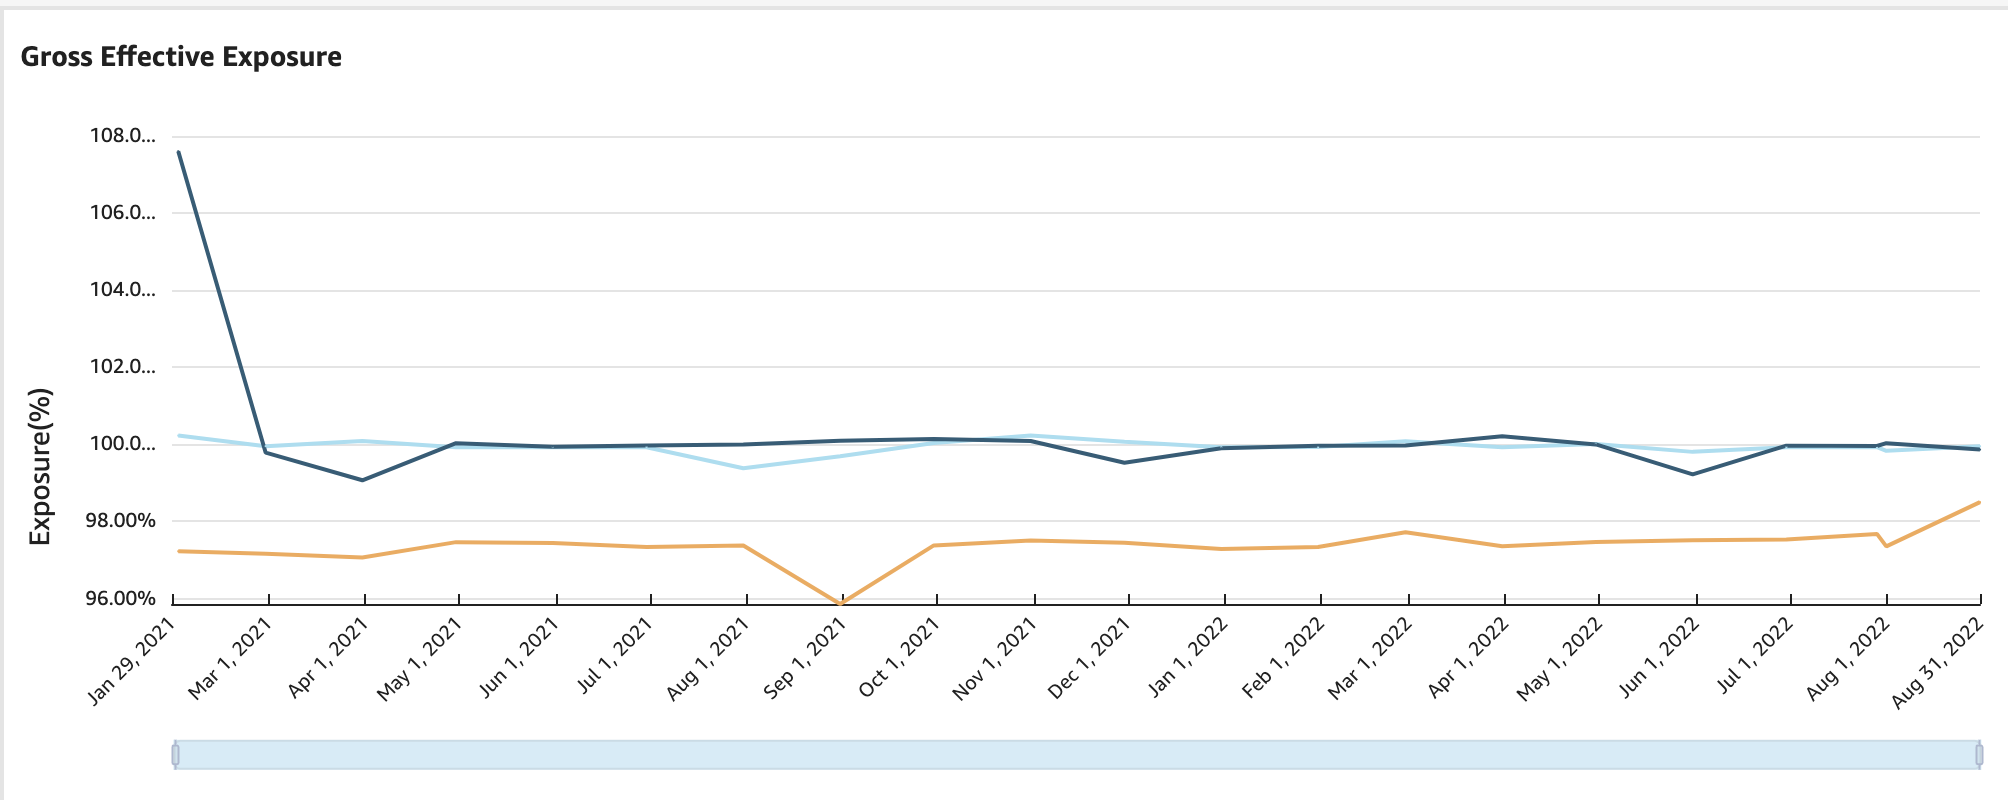
Real-time exposure analysis with look-through for funds and derivatives.
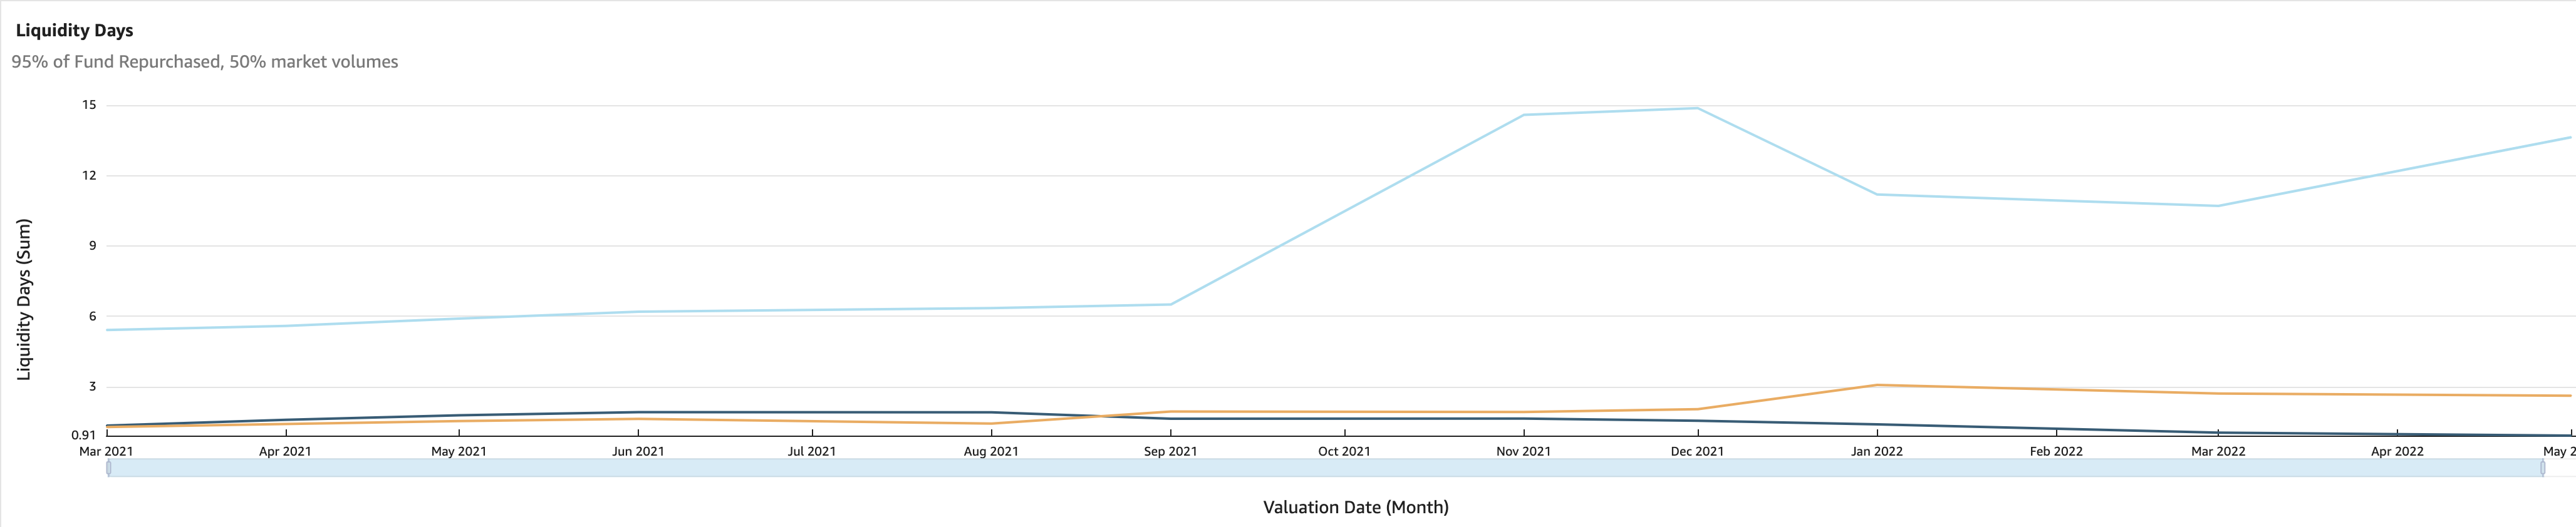
Standardized liquidity analysis with configurable redemption scenarios.
Stress testing and sensitivity analysis on demand, not once a day.
Professional dashboards and reports ready for investment committees.
Most buy-side firms struggle with fragmented data across legacy and siloed systems. Total Portfolio View addresses these core challenges.
Different systems for equities, fixed income, and alternatives create fragmented views. We consolidate data from multiple sources into a single, standardized model.
Incomplete or inconsistent data across systems undermines analysis. Our validation framework ensures data quality before it reaches your BI tools.
Data locked in legacy systems requires IT tickets to access. We liberate your data to users through BI tools and APIs for self-service analysis.
We integrate with any system that exposes data via API, including IBOR/ABOR systems (like BNY-EAGLE), performance systems, risk analytics (including our Dolphin-Risk), accounting systems, and market data providers. We use real-time API integration—not batch files—to ensure data is always current.
Total Portfolio View works with all major BI platforms including Tableau, Power BI, MicroStrategy, and AWS QuickSight. We expose data through standard interfaces, so your team can use the tools they already know. Custom dashboards and direct API access are also available.
Implementation typically takes 6-8 weeks with standard configurations, provided your source systems have API access and data is available. The timeline depends on the number of data sources and complexity of your portfolio structure. For clients using BNY-EAGLE, we have pre-built integrations that can accelerate deployment.
No. Total Portfolio View sits alongside your existing systems and aggregates data from them—we don't require you to replace your IBOR, performance, or accounting platforms. This "overlay" approach means faster implementation and lower risk compared to system replacements.
Vega is not a SaaS provider—we don't host your data. Total Portfolio View is deployed in your cloud environment (AWS, Azure, Google Cloud) or on-premise infrastructure. Your IT team manages the deployment, and your data never leaves your environment. This gives you complete control over security, compliance, and data sovereignty.
See how Total Portfolio View can transform how you understand and communicate portfolio risk.