Dolphin-Risk

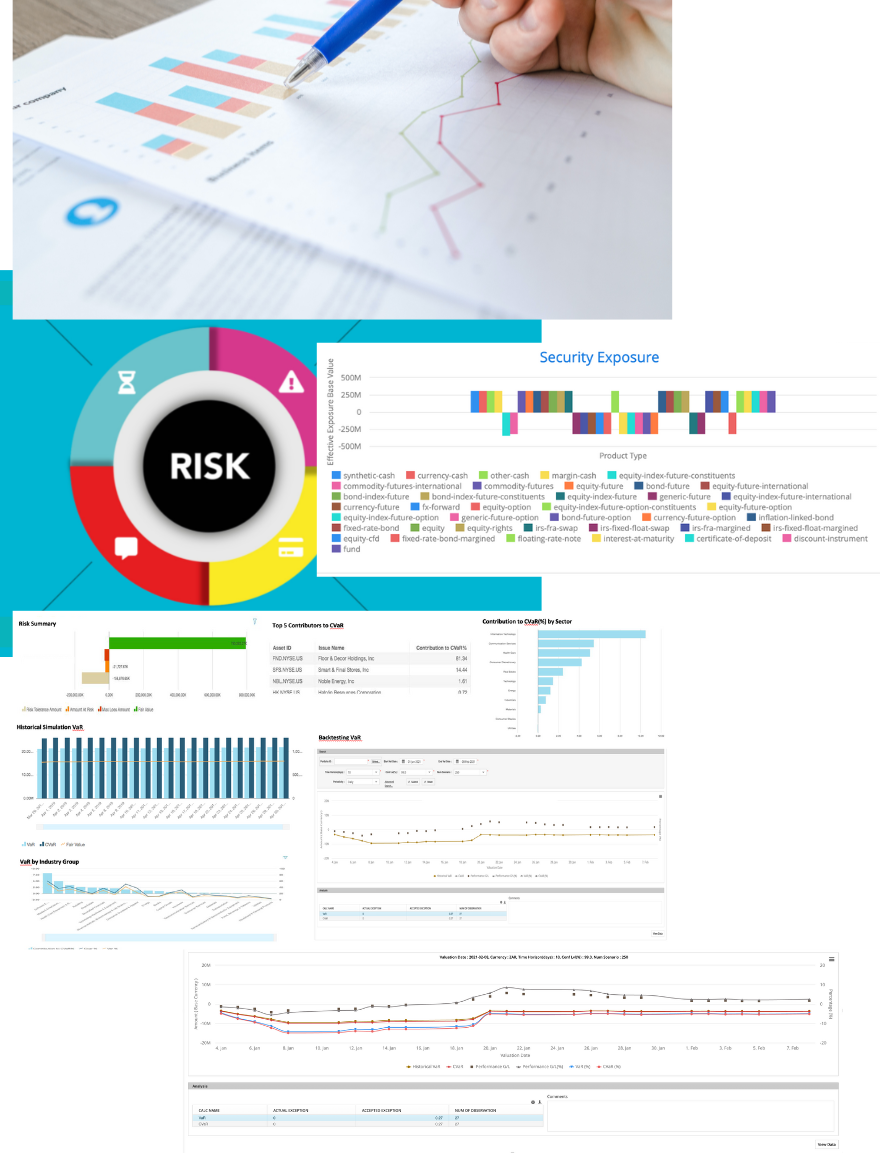
Forward-looking risk analytics for multi-asset portfolios. Calculate VaR, run stress tests, and answer "what if" questions—in real-time, not overnight.

Request a Demo See Features
Dolphin-Risk Analytics Dashboard
The Challenge

Why Forward-Looking Risk Analytics Matter Now

The Problem

Investors and managers demand access to portfolio data and real-time analysis. Yet most firms are stuck with backward-looking (ex-post) metrics that tell you what happened, not what could happen.

Conversations around 'risk' with clients are difficult—it needs to be explained in simple, easy-to-understand terms. Not just numbers, but what they mean in the portfolio's context.

On the institutional side, the challenge isn't whether risk capability exists—it's whether you have the technology to get answers to clients in real-time.

Our Approach

  • Open architecture with API-first data integration
  • Cloud-native with pay-per-use model using containers
  • Model transparency—see exactly how calculations work
  • Support for custom models by instrument or portfolio
  • Same market data as your performance/accounting systems

Target Market

  • Fund administrators and hedge fund managers
  • Multi-asset portfolio managers
  • RIAs and OCIO providers
  • Firms with roadmap to adopt cloud architecture
  • Organizations seeking pay-per-use operations model
Key Benefits

Risk Analytics That Keep Pace with Markets

Traditional risk systems run overnight batch calculations. By morning, markets have moved. Dolphin-Risk changes that.

Real-Time Calculations

Run risk analytics on demand using current positions and live prices. No waiting for overnight batch runs.

Model Transparency

See exactly how every number is calculated. Drill down from portfolio VaR to individual security contributions.

API Integration

Connects to your existing IBOR/ABOR via API. Uses the same prices as your performance and accounting systems.

Complete Risk Analytics Suite

Everything You Need for Forward-Looking Risk

Click any capability to see details, screenshots, and demo videos.

Core Analytics

Value at Risk (VaR) Analysis

Estimate maximum potential loss at specified confidence levels using Historical Simulation VaR with full portfolio revaluation. Understand not just the number, but where the risk is coming from.

Key Capabilities

  • Historical Simulation VaR — Full portfolio revaluation using historical scenarios
  • Expected Shortfall (CVaR) — Average loss beyond VaR threshold
  • Component VaR — Understand each position's contribution to total risk
  • Marginal VaR — Impact of adding/removing positions
  • Diversified & Undiversified VaR — See correlation benefits
  • Configurable parameters — Confidence level, time horizon, sample size

VaR Backtesting

Validate your risk model by comparing historical VaR predictions to actual outcomes. Essential for model governance and regulatory compliance. Includes exception tracking and model accuracy statistics.

VaR and CVaR Analysis

📹 See VaR Analysis in Action

Configure Historical VaR

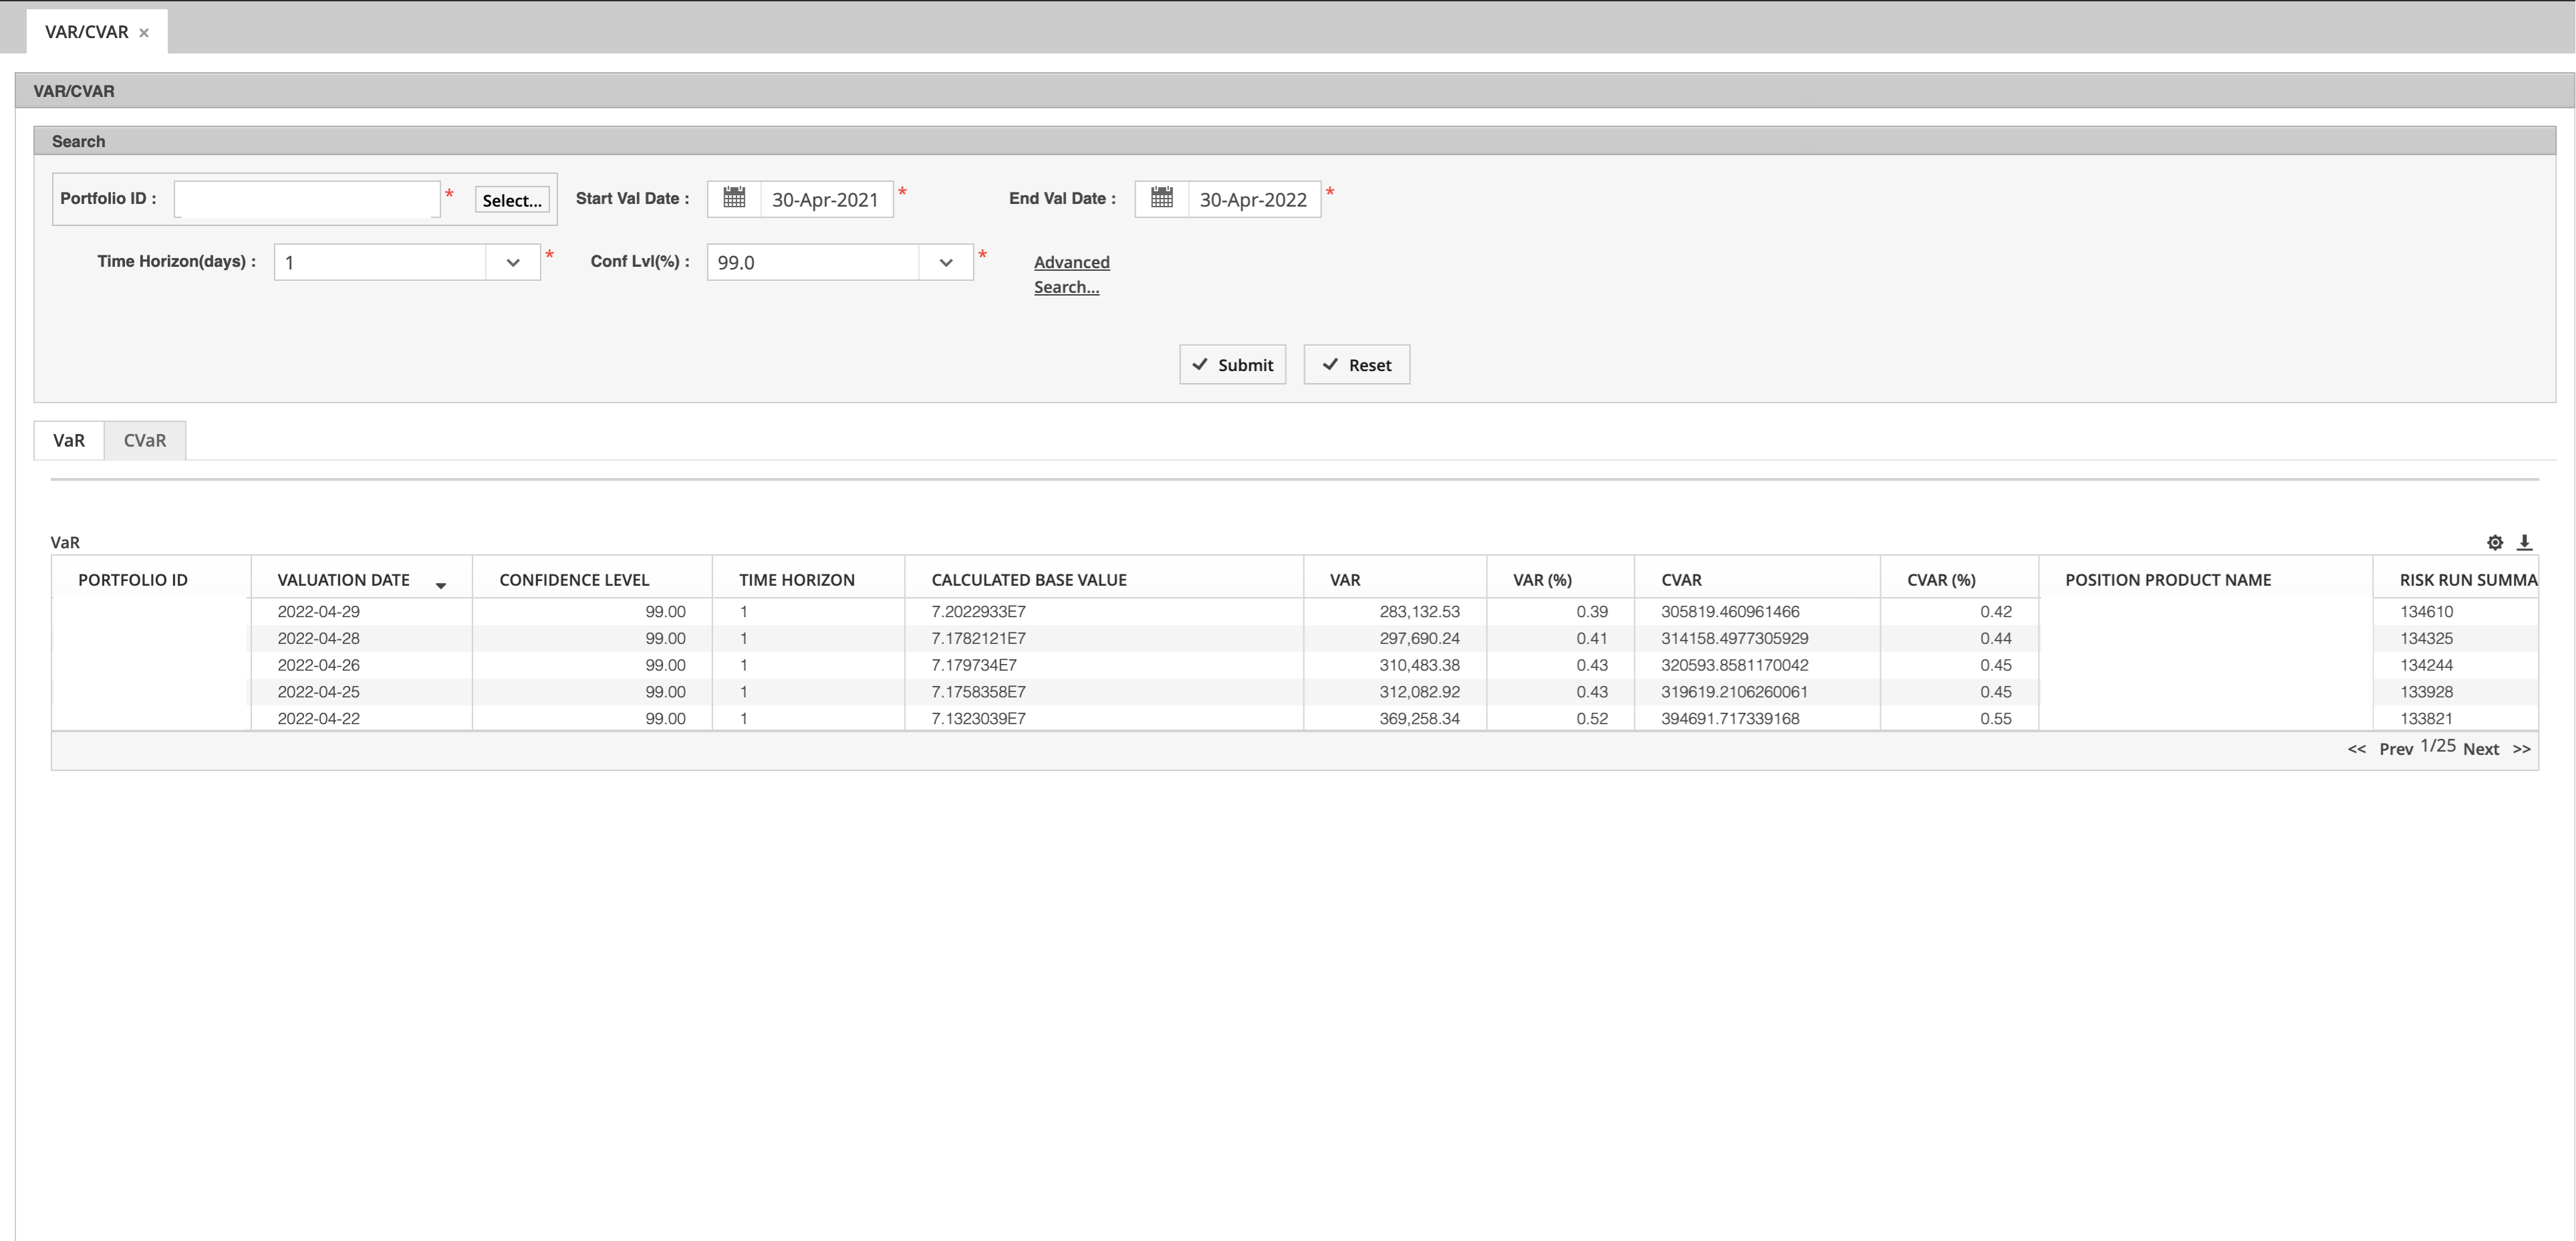
Set confidence level, time horizon, and sample size parameters.

Run VaR & View Results

Execute calculations and analyze CVaR, Component VaR, and attribution.

Core Analytics

Stress Testing

Analyze portfolio behavior under extreme market conditions with configurable factor shocks—interest rates, FX, credit spreads, asset prices, and volatility.

Key Capabilities

  • Yield curve shocks — Parallel and non-parallel shifts
  • FX rate scenarios — Currency devaluation impacts
  • Credit spread widening — Sector and rating impacts
  • Equity market shocks — Market-wide declines
  • Multi-factor scenarios — Combined shocks
  • Custom scenarios — Define your own stress tests
Stress Testing Configuration

📹 See Stress Testing in Action

Configure & Run Stress Tests

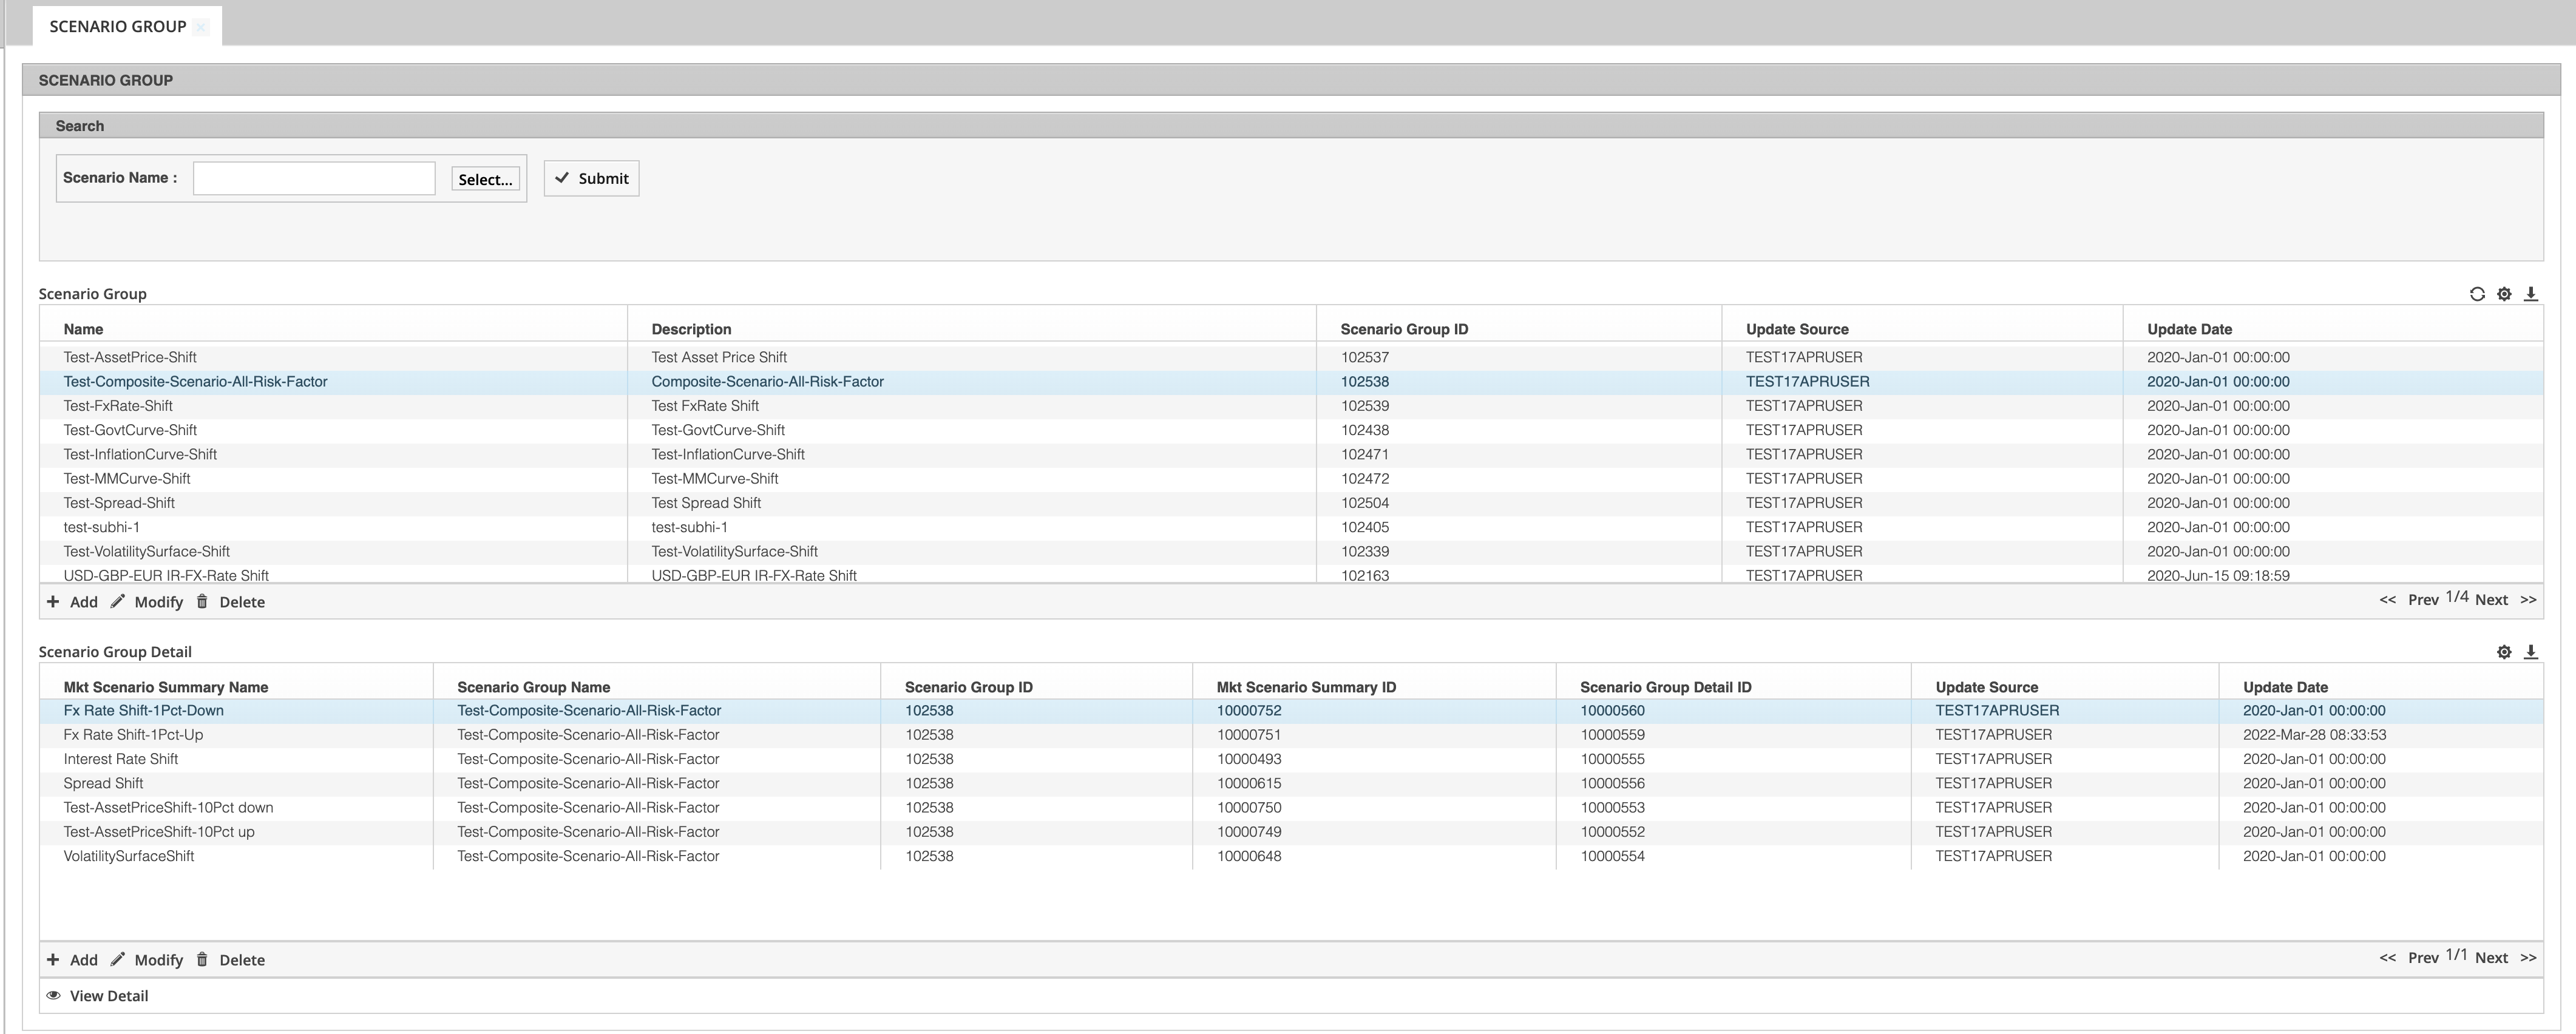
Set up factor shocks and see portfolio impact in real-time.

Core Analytics

Historical Scenario Analysis

Replay historical market events to understand how your current portfolio would have performed. See the impact of past crises on today's positions.

Pre-Built Historical Scenarios

  • COVID-19 (March 2020) — Pandemic market crash
  • Global Financial Crisis (2008) — Credit crisis impact
  • 9/11 (September 2001) — Market disruption
  • Dot-com crash (2000) — Tech bubble burst
  • Custom periods — Define your own historical windows

Analysis Output

  • P&L impact breakdown by asset class
  • Historical Scenario VaR
Historical Scenario Analysis

📹 See Scenario Analysis in Action

Run Historical Scenario Analysis

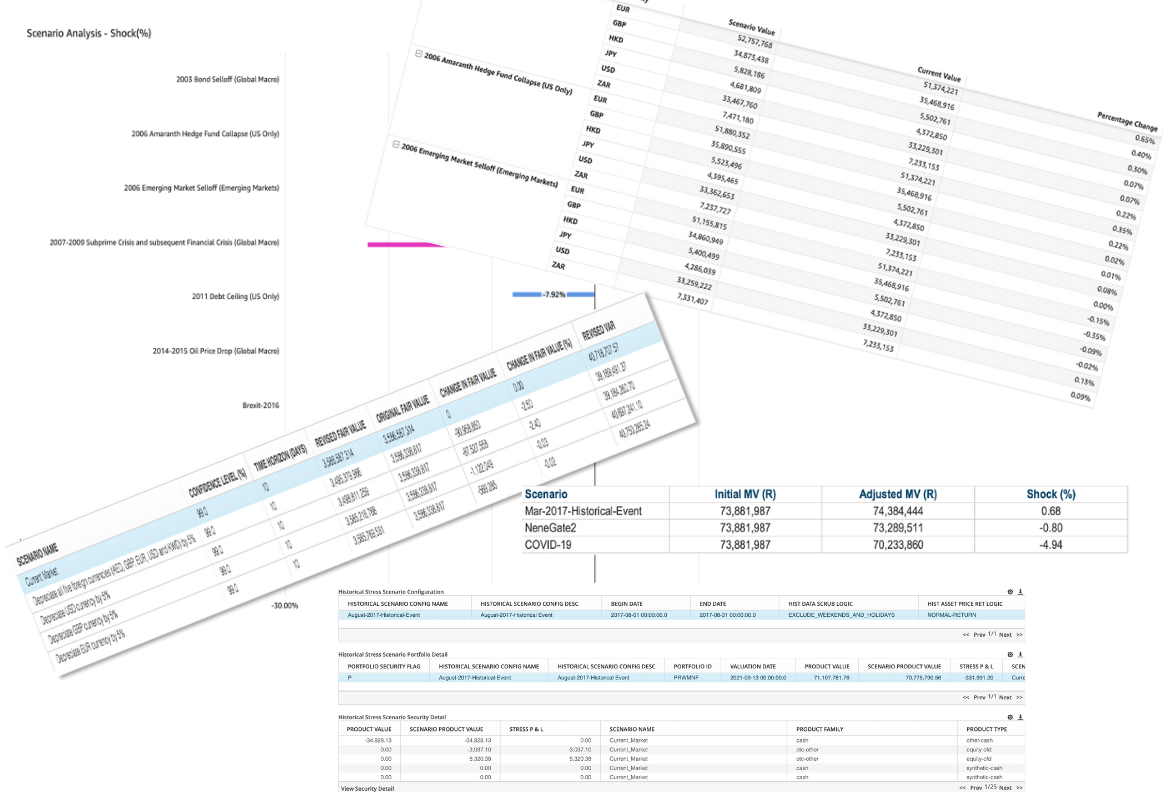
Replay market events like COVID-19 or GFC on your current portfolio.

Core Analytics

Sensitivity Analysis

Measure portfolio sensitivity to changes in key risk factors with detailed key rate duration, PV01, DV01, and credit spread analysis across tenor buckets.

Key Capabilities

  • Key Rate Duration (KRD) — Sensitivity by tenor bucket (3M, 6M, 1Y, 2Y, 5Y, 10Y, 30Y)
  • PV01 / DV01 — Dollar value change per 1bp yield move
  • CS01 — Credit spread sensitivity
  • Risk profile visualization — See where your curve risk concentrates
  • Option Greeks — Delta, Gamma, Vega, Theta, Rho for derivatives
Sensitivity Analysis - DV01

📹 See Sensitivity Analysis in Action

Calculate Sensitivities

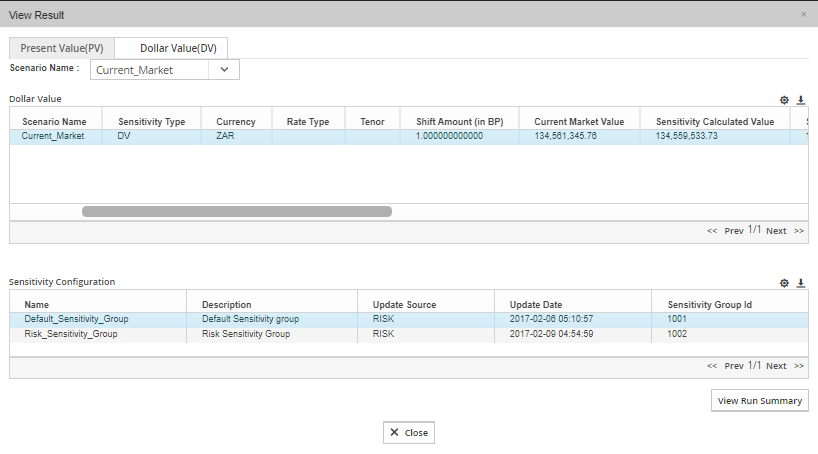
View PV01, DV01, CS01, and Key Rate Duration across tenor buckets.

Core Analytics

Liquidity Analytics

Understand how quickly positions can be liquidated and model redemption scenarios to ensure you can meet investor demands without significant market impact.

Key Capabilities

  • Days-to-liquidate — By position, based on trading volumes
  • Redemption scenarios — Model 25%, 50%, 75% redemptions
  • Market impact estimation — Price impact of liquidation
  • Liquidity stress testing — Stress market conditions
Liquidity Analytics

📹 See Liquidity Analytics in Action

Configure Liquidity Analysis

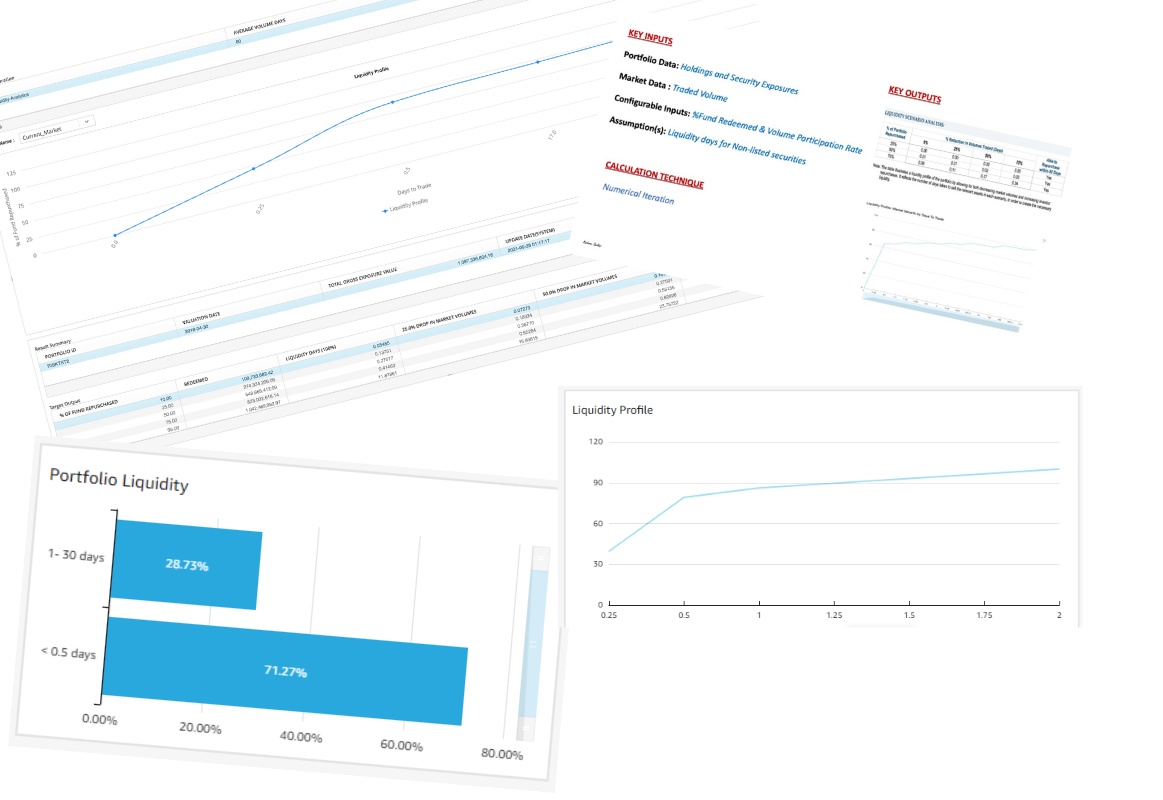
Set up analysis parameters and redemption scenarios.

View Liquidity Results

Analyze days-to-liquidate and redemption scenario impacts.

Core Analytics

Exposure Analysis

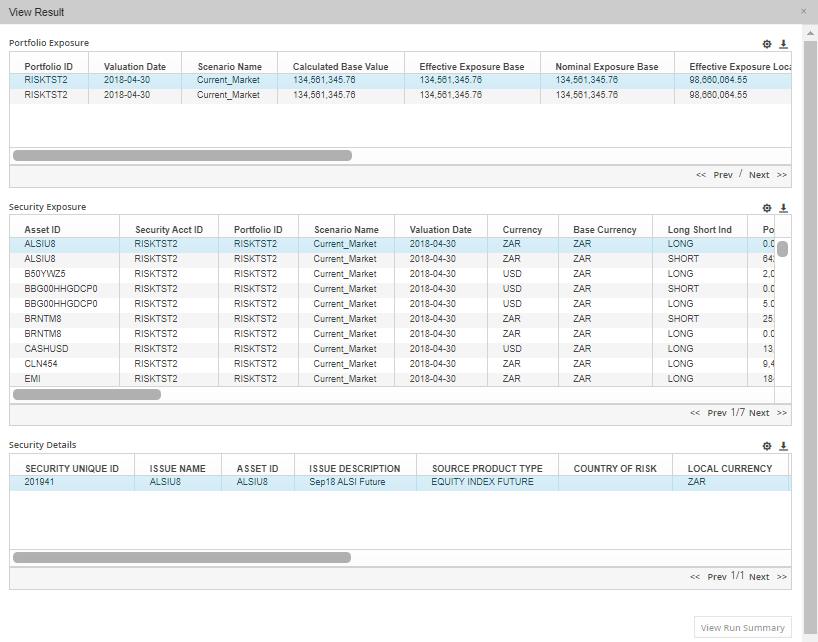
Understand your true portfolio exposure across asset classes, sectors, currencies, and geographies—including the real exposure created by derivatives.

Key Capabilities

  • Asset class allocation — Actual vs notional breakdown
  • Sector exposure — GICS classification
  • Geographic exposure — Country and region breakdown
  • Currency exposure — FX risk identification
  • Derivative exposure — Effective vs notional for futures, swaps, options
  • Concentration analysis — Top holdings and risk concentrations
Exposure Analysis by Asset Class

📹 See Exposure Analysis in Action

Analyze Portfolio Exposure

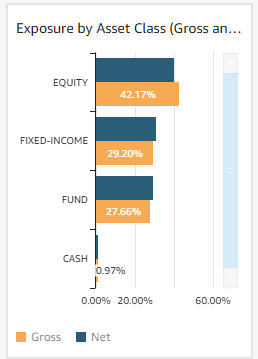
View exposure by asset class, sector, geography, and currency.

Core Analytics

What-If Analysis

Simulate the impact of trades before execution. See how adding or removing positions affects your portfolio's risk profile in real-time.

Key Capabilities

  • Real-time trade simulation — Test before you trade
  • Position impact analysis — Add/remove/modify positions
  • VaR impact preview — See VaR change before execution
  • Duration/exposure changes — Visualize allocation shifts
  • Rebalancing scenarios — Model portfolio restructuring
What-If Analysis Results
Additional Capabilities

Earnings at Risk (EaR) & Economic Value of Equity (EvE)

Understand how changes in interest rates affect your portfolio's future cash flows and overall economic value—critical for portfolios with floating rate exposure.

Key Capabilities

  • Cash flow projections — Under various rate scenarios
  • Floating rate impact — Income changes from rate moves
  • Income volatility (EaR) — Earnings sensitivity to rates
  • Portfolio value sensitivity (EvE) — Present value impact of shocks
Earnings at Risk Analysis
Additional Capabilities

Look-Through Analysis

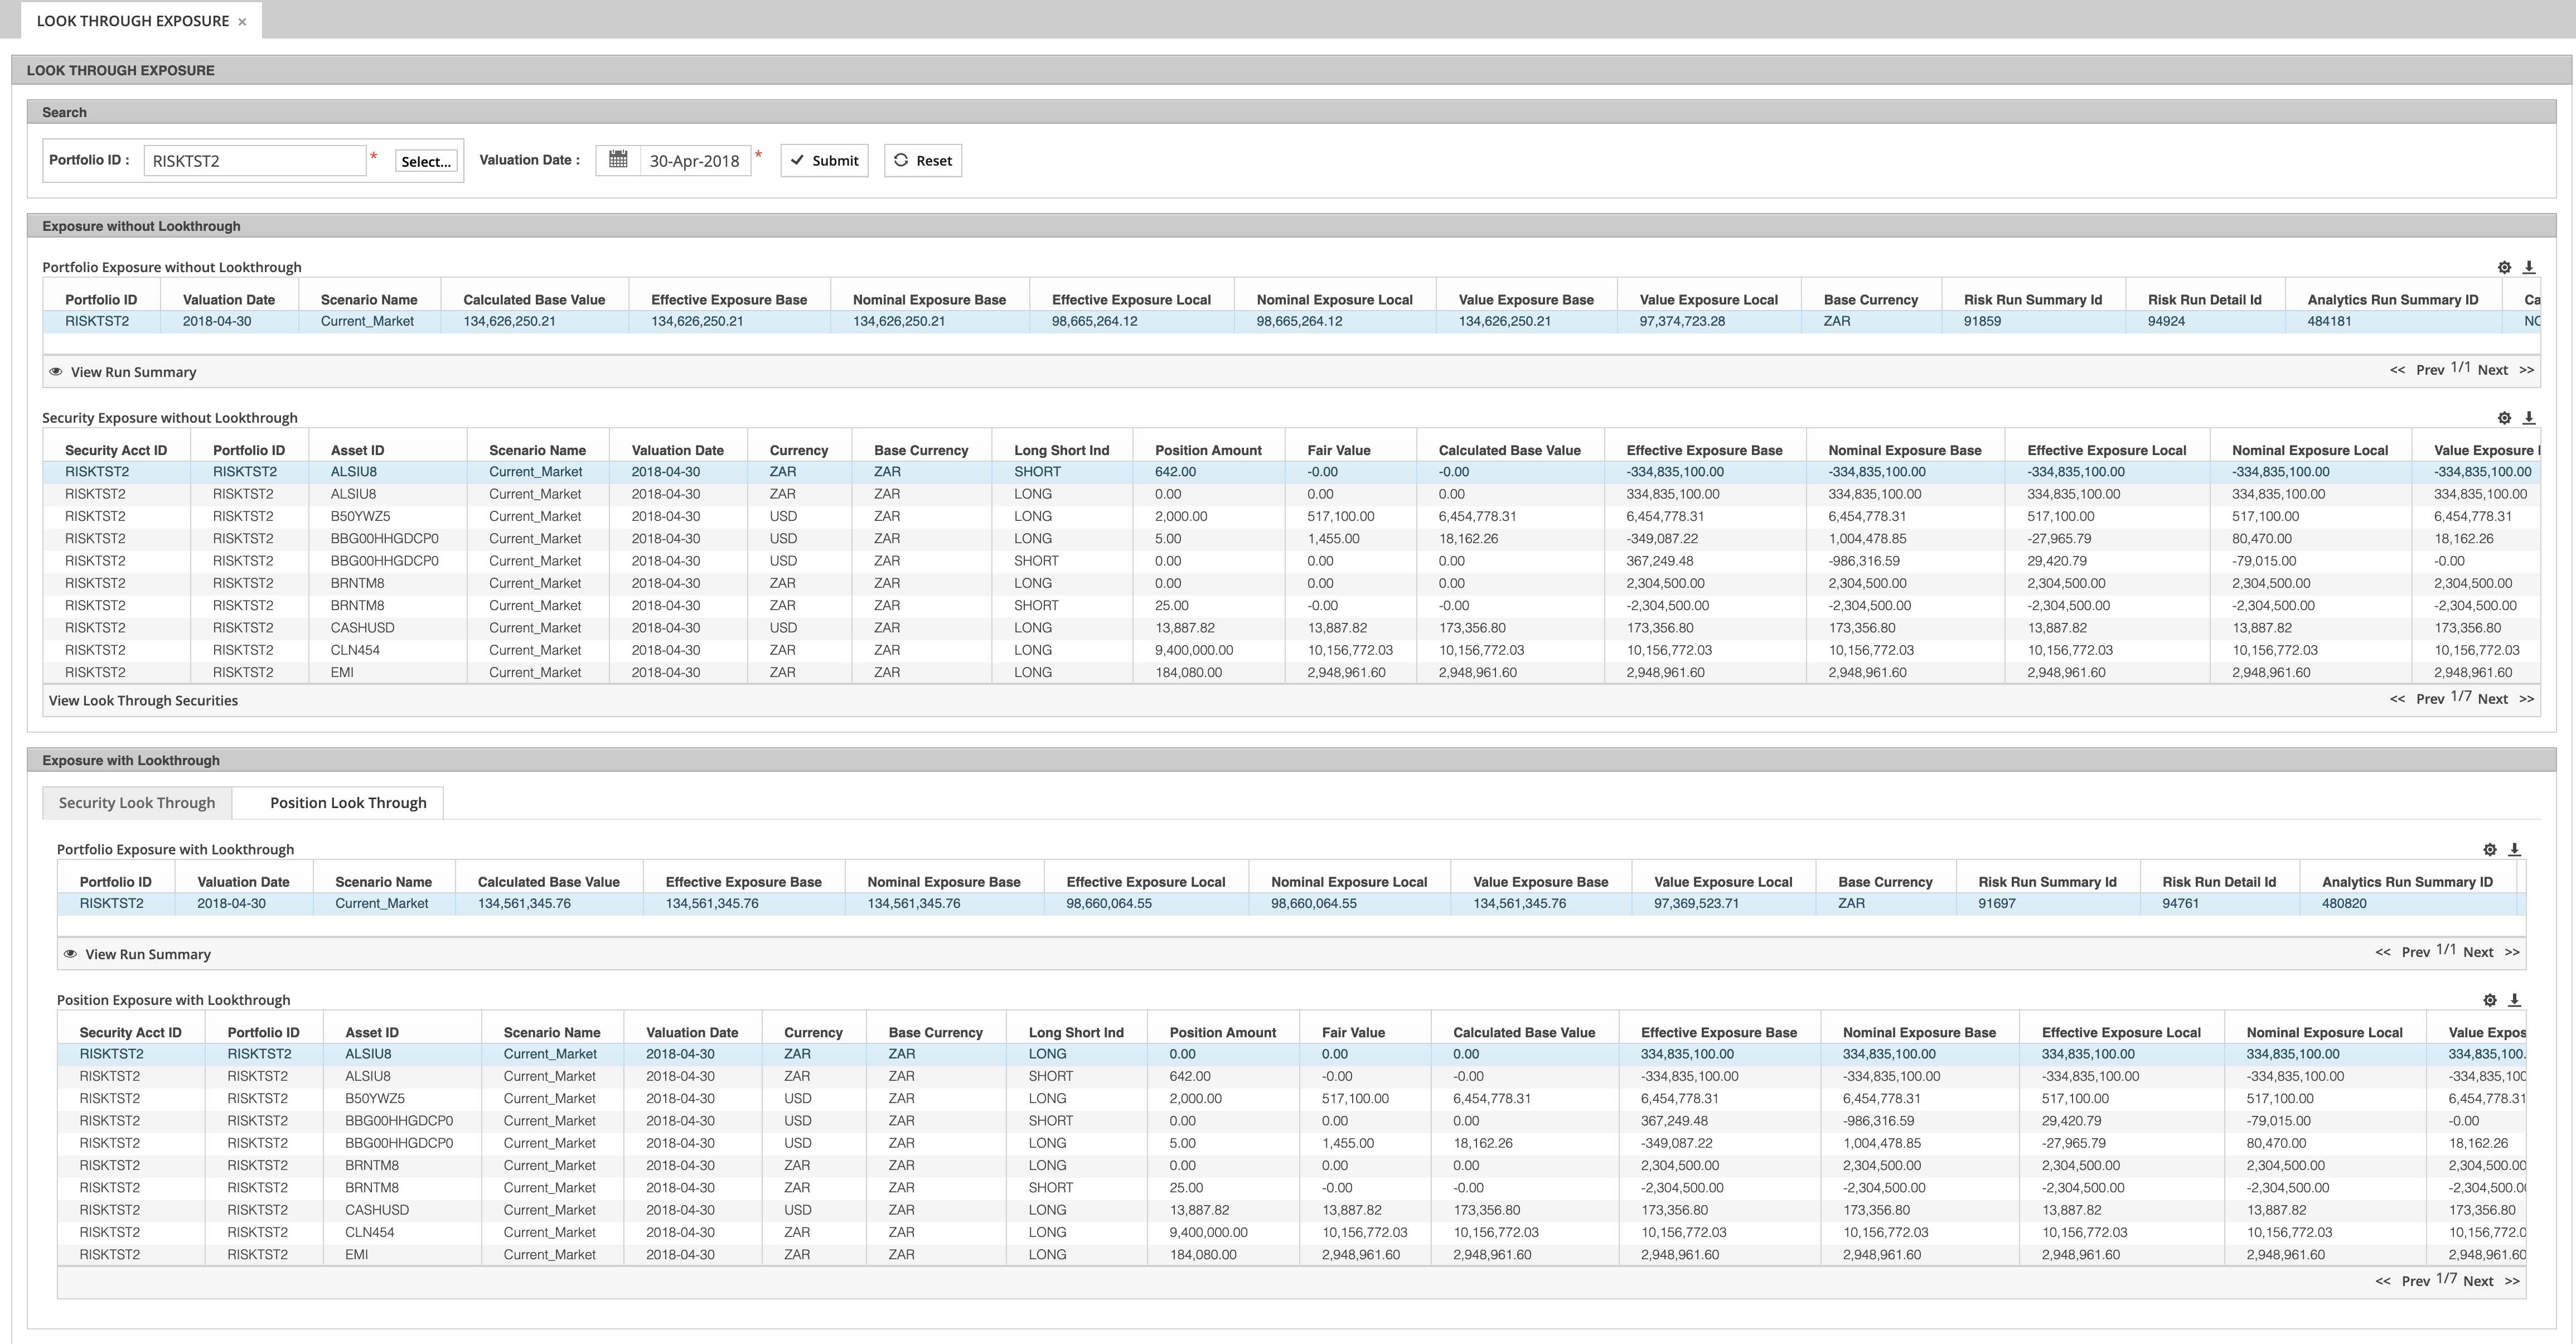
For portfolios containing funds, ETFs, or complex structures, see the actual underlying exposures—not just the wrapper.

Key Capabilities

  • Full look-through — See underlying holdings of funds/ETFs
  • Derivative decomposition — Actual exposure from derivatives
  • True allocation — Real sector/geographic exposure
Look-Through Analysis
Additional Capabilities

Security Analytics

Comprehensive analytics at the individual security level for fixed income and derivatives.

Fixed Income Analytics

  • Duration (Macaulay, Modified, Effective)
  • Convexity
  • Yield to Maturity / Yield to Worst
  • OAS & Z-Spread
  • Cash flow projections

Derivatives Analytics

  • Option Greeks (Delta, Gamma, Vega, Theta, Rho)
  • Implied volatility
  • Swap valuation and sensitivities

Security-level analytics available
for all supported instruments

Additional Capabilities

Ex-Post Analytics

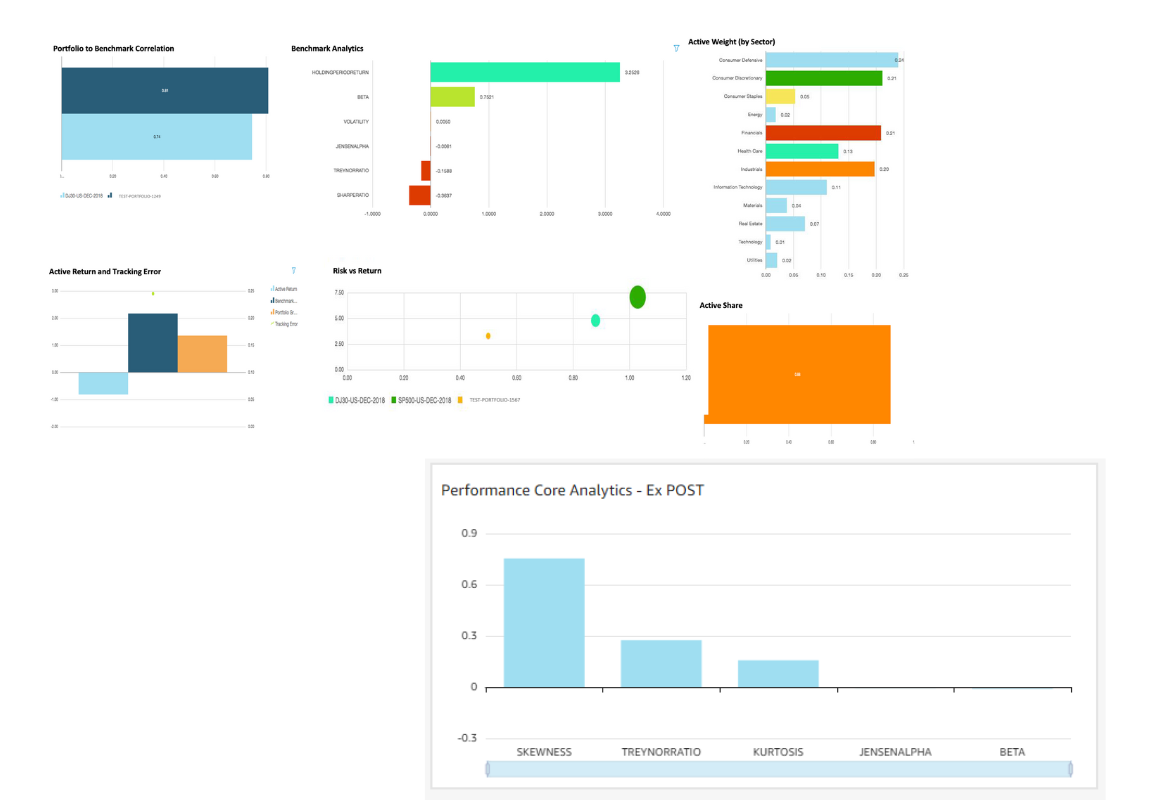
Backward-looking risk metrics for performance evaluation, attribution, and historical analysis.

Key Metrics

  • Tracking Error
  • Jensen Alpha
  • Sharpe Ratio
  • Sortino Ratio
  • Treynor Ratio
  • Information Ratio
  • Skewness & Kurtosis
  • Active Share

Comprehensive backward-looking
risk and performance metrics

Flexibility

Customization Options

Tailor analytics and risk models to your specific needs.

Custom Analytics

Extend Dolphin-Risk with your own analytics:

  • Provide specifications—we implement for you
  • Run your own models (Python, R, MATLAB, Java)
  • Custom security-level analytics
  • Bespoke calculations by instrument type

Custom Risk Modeling

Adapt risk models to your investment approach:

  • Customize models by instrument or portfolio
  • Adjust assumptions and parameters
  • Integrate proprietary methodologies
  • Full transparency into model behavior
Instrument Coverage

42+ Instrument Types Supported

From vanilla equities to complex OTC derivatives and alternatives, Dolphin-Risk handles the instruments in your portfolio.

Fixed Income

  • Fixed Rate Bonds
  • Floating Rate Notes (FRN)
  • Zero Coupon / Discount Instruments
  • Inflation-Linked Bonds (ILB)
  • MBS / ABS / CMBS
  • Certificates of Deposit
  • Interest at Maturity (IAM)
  • Negotiable CDs

Equities & Funds

  • Common Stock
  • Warrants & Rights
  • ETFs (with look-through)
  • Mutual Funds

Listed Derivatives

  • Equity / Index Futures
  • Bond / Bond Index Futures
  • Currency Futures
  • Commodity Futures
  • Equity Options
  • Index Options
  • Futures Options

OTC Derivatives

  • Interest Rate Swaps (IRS)
  • FX Forwards
  • Forward Rate Agreements (FRA)
  • CFDs
  • OTC Equity Options
  • Margined & Non-Margined

Alternative Investments

  • Long/Short Equity
  • Private Equity
  • Real Estate
  • Distressed Debt
  • Managed Futures
  • Senior Secured Loans
  • Venture Capital
  • Event-Driven Credit
Integration

Works with Your Existing Systems

Dolphin-Risk integrates via API with your current infrastructure—no rip-and-replace required.

BNY-Eagle

Pre-built integration enables 8-week implementation for BNY-Eagle clients using standard risk models.

Other IBOR/ABOR

REST API integration with any modern data management system. 8-16 weeks depending on number of instruments and data integration complexity.

Market Data

Uses your existing market data sources (Bloomberg, Reuters, ICE) under your licenses.

FAQ

Frequently Asked Questions

Common questions about Dolphin-Risk portfolio analytics.

How is the integration done with existing client data?

Using real-time APIs to get Holdings, Reference, and Market data from your existing data management system (IBOR/ABOR). We don't require batch file transfers—everything happens via API in real-time.

Can we use the same market data as our IBOR/ABOR?

Yes. Integration of all necessary market data is through your existing data management system. The same data used for performance and accounting is used for calculating risk analytics—eliminating reconciliation issues. We can also integrate with Bloomberg, Reuters, or EDI sources if needed.

How does real-time Risk Analytics work?

Because integration with your data management system uses APIs, users can make calculation requests through Dolphin's web interface or programmatically. Upon request, necessary input data is obtained from your systems and calculations are performed in real-time—no overnight batch processing required.

What calculations and analytics are included?

The platform includes comprehensive ex-ante analytics (VaR, CVaR, Stress Testing, Scenario Analysis, What-If Analysis, Liquidity Analytics, Sensitivity Analysis), ex-post metrics (Tracking Error, Sharpe Ratio, etc.), security-level analytics (Duration, Convexity, Greeks), and specialized measures like EaR and EvE. Use the feature navigation above to explore each capability in detail.

Is this a SaaS solution? Where is it hosted?

Vega is not a SaaS provider—we don't host your data. Dolphin-Risk is deployed in your cloud environment (AWS, Azure, Google Cloud) or on-premise infrastructure. Your IT team manages the deployment, and your data never leaves your environment. This gives you complete control over security, compliance, and data sovereignty. We provide subscription-based licensing for the software.

See Dolphin-Risk in Action

Let us show you how real-time risk analytics can transform how you manage portfolios and serve clients.